Reliability Analysis of Time – Dependent Stress- Strength System When the Number of Cycles Follow Binomial Distribution
N. Swathi1*, T. Sumathi Uma Maheswari2
1,2Department of Mathematics, Kakatiya University, Warangal, Andhra Pradesh, INDIA.
*Corresponding Address:
[email protected]
Abstract: Reliability analysis of time dependent stress strength system is carried out by using stress / strength models considering each of the stress and strength variables as deterministic or random fixed or random independent. The number of cycles in any period of time t is assumed to berandom. Reliability is found for the nine models when the number of cycles follows binomial distribution where stress and strength follow exponential distribution.
Keywords: Binomial distribution, Exponential distribution, deterministic, random- fixed, random- independent and Reliability.
Introduction
Time dependent stress strength system is defined by [1]. A component fails if the stress on it is exceeding than its strength. In the present paper, the uncertainty about the stress and strength variables is classified into three categories:
- Deterministic: the variable assumes values that are exactly known a priory.
- Random fixed: the variable is random at any particular instant of time; the word fixed in this classification refers to the behaviour of the random variable with respect to time and/or cycles; it means that the random variable changes or varies with time in a known manner.
- Random independent: the variable is not only random but unlike the random fixed case, the successive values assumed by the variables are statistically independent, in accordance with Kapur and Lamberson and Schatz, et al.Here, in this paper, the components are assumed to be identical and the number of cycles for any time period t is assumed to be random. Expression for system reliability have been attained when number of cycles can be follow binomial distribution and stress and strength both follow exponential distribution.
Notation
Reliability Evaluation:
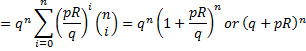
Number of cycles occurring in a given time interval is follows Binomial distribution
Case 1: Deterministic Stress and Deterministic Strength
Let the stress be known and non decreasing and strength be known and non increasing. Let be such that . Then we have and
Case 2: Deterministic Stress and random- fixed Strength
Let the stress be a known constant. Let be the strength random variable with a known probability density function . Then
Case 3: Deterministic Stress and Random independent Strength
Let the stress be a known constant . Let be the probability density function of random- independent strength y. Then
Case 4: Random - fixed Stress and deterministic Strength
Let be the random fixed stress with a known probability density function that does not vary with time and is the deterministically known strength i.e. constant in time. Then
Case 5: Random - fixed Stress and random- fixed Strength
Let and be the random fixed stress and strength with known probability density functions and respectively. and will be assumed not vary with timethat is . Hence
Case 6: Random - fixed Stress and Random- independent Strength
Let is the probability density function of random fixed stress and is the probability density function of random independent strength . We have
Case 7: Random - independent Stress and deterministic Strength
The random independent stress is denoted by and the deterministic strength by which is constant in time. Then
Case 8: Random - independent Stress and Random- fixed Strength
Let g is the probability density function of random fixed strength and f is the probability density function of random independent stress X. We have
Case 9: Random- independent Stress and random- independent Strength
Let represent the probability density functions for stress and strength respectively. Further the random variables be independent on each cycle. Then
In Binomial Distribution, the Stress and Strength Follow Exponential Distribution
Case 2: Deterministic Stress and random- fixed Strength
Case 3: Deterministic Stress and random- independent Strength
Case 4: Random- fixed stress and deterministic Strength
Case 5: Random- fixed Stress and random- fixed Strength
Case 6: Random- fixed Stress and random- independent Strength
Case 7: Random- independent Stress and deterministic Strength
Case 8: Random- independent Stress and random- fixed Strength
Case 9: Random- independent Stress and random- independent Strength
Numerical Results
Case 2: Deterministic Stress and random- fixed Strength:
Table 1
n |
|
Q |
|
R |
1 |
0.2 |
0.5 |
2 |
0.83516 |
2 |
0.2 |
0.5 |
2 |
0.75274 |
3 |
0.2 |
0.5 |
2 |
0.71153 |
4 |
0.2 |
0.5 |
2 |
0.690925 |
5 |
0.2 |
0.5 |
2 |
0.680623 |
6 |
0.2 |
0.5 |
2 |
0.675471 |
7 |
0.2 |
0.5 |
2 |
0.672896 |
8 |
0.2 |
0.5 |
2 |
0.671608 |
9 |
0.2 |
0.5 |
2 |
0.670964 |
10 |
0.2 |
0.5 |
2 |
0.670642 |
Table 2
n |
|
Q |
|
R |
1 |
0.1 |
0.5 |
2 |
0.909365 |
2 |
0.2 |
0.5 |
2 |
0.75274 |
3 |
0.3 |
0.5 |
2 |
0.60521 |
4 |
0.4 |
0.5 |
2 |
0.483746 |
5 |
0.5 |
0.5 |
2 |
0.387633 |
6 |
0.6 |
0.5 |
2 |
0.312113 |
7 |
0.7 |
0.5 |
2 |
0.252483 |
8 |
0.8 |
0.5 |
2 |
0.205014 |
9 |
0.9 |
0.5 |
2 |
0.166929 |
10 |
1 |
0.5 |
2 |
0.13618 |
Table 3
n |
|
q |
|
R |
1 |
0.1 |
0.5 |
2 |
0.909365 |
1 |
0.2 |
0.5 |
2 |
0.83516 |
1 |
0.3 |
0.5 |
2 |
0.774406 |
1 |
0.4 |
0.5 |
2 |
0.724664 |
1 |
0.5 |
0.5 |
2 |
0.68394 |
1 |
0.6 |
0.5 |
2 |
0.650597 |
1 |
0.7 |
0.5 |
2 |
0.623298 |
1 |
0.8 |
0.5 |
2 |
0.600948 |
1 |
0.9 |
0.5 |
2 |
0.582649 |
1 |
1 |
0.5 |
2 |
0.567668 |
Table 4
n |
|
q |
|
R |
1 |
0.5 |
0.1 |
2 |
0.431091 |
2 |
0.5 |
0.2 |
2 |
0.393164 |
3 |
0.5 |
0.3 |
2 |
0.384947 |
4 |
0.5 |
0.4 |
2 |
0.384062 |
5 |
0.5 |
0.5 |
2 |
0.387633 |
6 |
0.5 |
0.6 |
2 |
0.397372 |
7 |
0.5 |
0.7 |
2 |
0.419937 |
8 |
0.5 |
0.8 |
2 |
0.473932 |
9 |
0.5 |
0.9 |
2 |
0.612776 |
10 |
0.5 |
1 |
2 |
1 |
Table 5
n |
|
q |
|
R |
1 |
0.5 |
0.1 |
2 |
0.431091 |
1 |
0.5 |
0.2 |
2 |
0.494304 |
1 |
0.5 |
0.3 |
2 |
0.557516 |
1 |
0.5 |
0.4 |
2 |
0.620728 |
1 |
0.5 |
0.5 |
2 |
0.68394 |
1 |
0.5 |
0.6 |
2 |
0.747152 |
1 |
0.5 |
0.7 |
2 |
0.810364 |
1 |
0.5 |
0.8 |
2 |
0.873576 |
1 |
0.5 |
0.9 |
2 |
0.936788 |
1 |
0.5 |
1 |
2 |
1 |
Table 6:
n |
|
q |
|
R |
1 |
0.5 |
0.9 |
2 |
0.936788 |
1 |
0.5 |
0.8 |
2 |
0.873576 |
1 |
0.5 |
0.7 |
2 |
0.810364 |
1 |
0.5 |
0.6 |
2 |
0.747152 |
1 |
0.5 |
0.5 |
2 |
0.68394 |
1 |
0.5 |
0.4 |
2 |
0.620728 |
1 |
0.5 |
0.3 |
2 |
0.557516 |
1 |
0.5 |
0.2 |
2 |
0.494304 |
1 |
0.5 |
0.1 |
2 |
0.431091 |
1 |
0.5 |
0 |
2 |
0.367879 |
Table 7:
n |
|
q |
|
R |
1 |
0.5 |
0.2 |
0.1 |
0.960984 |
2 |
0.5 |
0.2 |
0.2 |
0.908644 |
3 |
0.5 |
0.2 |
0.3 |
0.861822 |
4 |
0.5 |
0.2 |
0.4 |
0.819021 |
5 |
0.5 |
0.2 |
0.5 |
0.778872 |
6 |
0.5 |
0.2 |
0.6 |
0.740835 |
7 |
0.5 |
0.2 |
0.7 |
0.704692 |
8 |
0.5 |
0.2 |
0.8 |
0.670321 |
9 |
0.5 |
0.2 |
0.9 |
0.637628 |
10 |
0.5 |
0.2 |
1 |
0.606531 |
Case 3: Deterministic Stress and Random- independent Strength:
Table 1:
n |
|
p |
q |
|
R |
1 |
0.1 |
0.1 |
0.9 |
0.2 |
0.99802 |
2 |
0.1 |
0.2 |
0.8 |
0.2 |
0.992095 |
3 |
0.1 |
0.3 |
0.7 |
0.2 |
0.982284 |
4 |
0.1 |
0.4 |
0.6 |
0.2 |
0.968692 |
5 |
0.1 |
0.5 |
0.5 |
0.2 |
0.951467 |
6 |
0.1 |
0.6 |
0.4 |
0.2 |
0.930799 |
7 |
0.1 |
0.7 |
0.3 |
0.2 |
0.906916 |
8 |
0.1 |
0.8 |
0.2 |
0.2 |
0.88008 |
9 |
0.1 |
0.9 |
0.1 |
0.2 |
0.85058 |
10 |
0.1 |
1 |
0 |
0.2 |
0.818731 |
Table 2:
n |
|
P |
q |
|
R |
1 |
0.5 |
0.9 |
0.1 |
0.2 |
0.914354 |
2 |
0.5 |
0.8 |
0.2 |
0.2 |
0.853536 |
3 |
0.5 |
0.7 |
0.3 |
0.2 |
0.813175 |
4 |
0.5 |
0.6 |
0.4 |
0.2 |
0.790437 |
5 |
0.5 |
0.5 |
0.5 |
0.2 |
0.783681 |
6 |
0.5 |
0.4 |
0.6 |
0.2 |
0.792272 |
7 |
0.5 |
0.3 |
0.7 |
0.2 |
0.816483 |
8 |
0.5 |
0.2 |
0.8 |
0.2 |
0.857505 |
9 |
0.5 |
0.1 |
0.9 |
0.2 |
0.917542 |
10 |
0.5 |
0 |
1 |
0.2 |
1 |
Table 3:
n |
|
P |
q |
|
R |
2 |
0.1 |
0.1 |
0.9 |
0.5 |
0.99027 |
2 |
0.2 |
0.2 |
0.8 |
0.5 |
0.962297 |
2 |
0.3 |
0.3 |
0.7 |
0.5 |
0.918171 |
2 |
0.4 |
0.4 |
0.6 |
0.5 |
0.860242 |
2 |
0.5 |
0.5 |
0.5 |
0.5 |
0.791033 |
2 |
0.6 |
0.6 |
0.4 |
0.5 |
0.713165 |
2 |
0.7 |
0.7 |
0.3 |
0.5 |
0.629296 |
2 |
0.8 |
0.8 |
0.2 |
0.5 |
0.542073 |
2 |
0.9 |
0.9 |
0.1 |
0.5 |
0.454094 |
2 |
1 |
1 |
0 |
0.5 |
0.367879 |
Table 4
n |
|
P |
q |
|
R |
2 |
0.1 |
0.9 |
0.1 |
0.5 |
0.91414 |
2 |
0.2 |
0.8 |
0.2 |
0.5 |
0.853536 |
2 |
0.3 |
0.7 |
0.3 |
0.5 |
0.814498 |
2 |
0.4 |
0.6 |
0.4 |
0.5 |
0.794306 |
2 |
0.5 |
0.5 |
0.5 |
0.5 |
0.791033 |
2 |
0.6 |
0.4 |
0.6 |
0.5 |
0.803403 |
2 |
0.7 |
0.3 |
0.7 |
0.5 |
0.830662 |
2 |
0.8 |
0.2 |
0.8 |
0.5 |
0.872476 |
2 |
0.9 |
0.1 |
0.9 |
0.5 |
0.928839 |
2 |
1 |
0 |
1 |
0.5 |
1 |
Table 5
n |
|
P |
q |
|
R |
2 |
0.5 |
0.1 |
0.9 |
0.1 |
0.99027 |
2 |
0.5 |
0.2 |
0.8 |
0.2 |
0.962297 |
2 |
0.5 |
0.3 |
0.7 |
0.3 |
0.918171 |
2 |
0.5 |
0.4 |
0.6 |
0.4 |
0.860242 |
2 |
0.5 |
0.5 |
0.5 |
0.5 |
0.791033 |
2 |
0.5 |
0.6 |
0.4 |
0.6 |
0.713165 |
2 |
0.5 |
0.7 |
0.3 |
0.7 |
0.629296 |
2 |
0.5 |
0.8 |
0.2 |
0.8 |
0.542073 |
2 |
0.5 |
0.9 |
0.1 |
0.9 |
0.454094 |
2 |
0.5 |
1 |
0 |
1 |
0.367879 |
Table 6
n |
|
P |
q |
|
R |
2 |
0.5 |
0.9 |
0.1 |
0.1 |
0.91414 |
2 |
0.5 |
0.8 |
0.2 |
0.2 |
0.853536 |
2 |
0.5 |
0.7 |
0.3 |
0.3 |
0.814498 |
2 |
0.5 |
0.6 |
0.4 |
0.4 |
0.794306 |
2 |
0.5 |
0.5 |
0.5 |
0.5 |
0.791033 |
2 |
0.5 |
0.4 |
0.6 |
0.6 |
0.803403 |
2 |
0.5 |
0.3 |
0.7 |
0.7 |
0.830662 |
2 |
0.5 |
0.2 |
0.8 |
0.8 |
0.872476 |
2 |
0.5 |
0.1 |
0.9 |
0.9 |
0.928839 |
2 |
0.5 |
0 |
1 |
1 |
1 |
Table 7
n |
|
P |
q |
|
R |
1 |
0.5 |
0.9 |
0.1 |
0.1 |
0.956106 |
2 |
0.5 |
0.8 |
0.2 |
0.2 |
0.853536 |
3 |
0.5 |
0.7 |
0.3 |
0.3 |
0.735081 |
4 |
0.5 |
0.6 |
0.4 |
0.4 |
0.630922 |
5 |
0.5 |
0.5 |
0.5 |
0.5 |
0.556527 |
6 |
0.5 |
0.4 |
0.6 |
0.6 |
0.518561 |
7 |
0.5 |
0.3 |
0.7 |
0.7 |
0.522378 |
8 |
0.5 |
0.2 |
0.8 |
0.8 |
0.579446 |
9 |
0.5 |
0.1 |
0.9 |
0.9 |
0.717351 |
10 |
0.5 |
0 |
1 |
1 |
1 |
Case 4: Random- fixed stress and deterministic Strength
Table 1
n |
l |
q |
|
R |
1 |
0.1 |
0.5 |
2 |
0.590635 |
2 |
0.2 |
0.5 |
2 |
0.49726 |
3 |
0.3 |
0.5 |
2 |
0.51979 |
4 |
0.4 |
0.5 |
2 |
0.578754 |
5 |
0.5 |
0.5 |
2 |
0.643617 |
6 |
0.6 |
0.5 |
2 |
0.703512 |
7 |
0.7 |
0.5 |
2 |
0.75533 |
8 |
0.8 |
0.5 |
2 |
0.798892 |
9 |
0.9 |
0.5 |
2 |
0.835024 |
10 |
1 |
0.5 |
2 |
0.864797 |
Table 2
n |
l |
q |
|
R |
2 |
0.1 |
0.5 |
2 |
0.385952 |
2 |
0.2 |
0.5 |
2 |
0.49726 |
2 |
0.3 |
0.5 |
2 |
0.588391 |
2 |
0.4 |
0.5 |
2 |
0.663003 |
2 |
0.5 |
0.5 |
2 |
0.72409 |
2 |
0.6 |
0.5 |
2 |
0.774104 |
2 |
0.7 |
0.5 |
2 |
0.815052 |
2 |
0.8 |
0.5 |
2 |
0.848578 |
2 |
0.9 |
0.5 |
2 |
0.876026 |
2 |
1 |
0.5 |
2 |
0.898499 |
Table 3
n |
l |
q |
|
R |
2 |
0.5 |
0.1 |
2 |
0.635799 |
2 |
0.5 |
0.2 |
2 |
0.646836 |
2 |
0.5 |
0.3 |
2 |
0.66523 |
2 |
0.5 |
0.4 |
2 |
0.690981 |
2 |
0.5 |
0.5 |
2 |
0.72409 |
2 |
0.5 |
0.6 |
2 |
0.764557 |
2 |
0.5 |
0.7 |
2 |
0.812381 |
2 |
0.5 |
0.8 |
2 |
0.867563 |
2 |
0.5 |
0.9 |
2 |
0.930103 |
2 |
0.5 |
1 |
2 |
1 |
Table 4
n |
l |
Q |
|
R |
2 |
0.5 |
0.9 |
2 |
0.930103 |
2 |
0.5 |
0.8 |
2 |
0.867563 |
2 |
0.5 |
0.7 |
2 |
0.812381 |
2 |
0.5 |
0.6 |
2 |
0.764557 |
2 |
0.5 |
0.5 |
2 |
0.72409 |
2 |
0.5 |
0.4 |
2 |
0.690981 |
2 |
0.5 |
0.3 |
2 |
0.66523 |
2 |
0.5 |
0.2 |
2 |
0.646836 |
2 |
0.5 |
0.1 |
2 |
0.635799 |
2 |
0.5 |
0 |
2 |
0.632121 |
Table 5
n |
l |
q |
|
R |
2 |
0.5 |
0.2 |
1 |
0.417731 |
2 |
0.5 |
0.2 |
2 |
0.646836 |
2 |
0.5 |
0.2 |
3 |
0.785795 |
2 |
0.5 |
0.2 |
4 |
0.870078 |
2 |
0.5 |
0.2 |
5 |
0.921198 |
2 |
0.5 |
0.2 |
6 |
0.952204 |
2 |
0.5 |
0.2 |
7 |
0.971011 |
2 |
0.5 |
0.2 |
8 |
0.982417 |
2 |
0.5 |
0.2 |
9 |
0.989335 |
2 |
0.5 |
0.2 |
10 |
0.993532 |
Case 5: random – fixed Stress and random- fixed Strength
Table 1
n |
l |
q |
|
R |
1 |
3 |
0.5 |
2 |
0.8 |
2 |
3 |
0.5 |
2 |
0.7 |
3 |
3 |
0.5 |
2 |
0.65 |
4 |
3 |
0.5 |
2 |
0.625 |
5 |
3 |
0.5 |
2 |
0.6125 |
6 |
3 |
0.5 |
2 |
0.60625 |
7 |
3 |
0.5 |
2 |
0.603125 |
8 |
3 |
0.5 |
2 |
0.601563 |
9 |
3 |
0.5 |
2 |
0.600781 |
10 |
3 |
0.5 |
2 |
0.600391 |
Table 2
n |
l |
q |
|
R |
2 |
1 |
0.5 |
0.5 |
0.75 |
2 |
2 |
0.5 |
0.5 |
0.85 |
2 |
3 |
0.5 |
0.5 |
0.892857 |
2 |
4 |
0.5 |
0.5 |
0.916667 |
2 |
5 |
0.5 |
0.5 |
0.931818 |
2 |
6 |
0.5 |
0.5 |
0.942308 |
2 |
7 |
0.5 |
0.5 |
0.95 |
2 |
8 |
0.5 |
0.5 |
0.955882 |
2 |
9 |
0.5 |
0.5 |
0.960526 |
2 |
10 |
0.5 |
0.5 |
0.964286 |
Table 3
n |
l |
q |
|
R |
2 |
0.5 |
0.1 |
0.5 |
0.505 |
2 |
0.5 |
0.2 |
0.5 |
0.52 |
2 |
0.5 |
0.3 |
0.5 |
0.545 |
2 |
0.5 |
0.4 |
0.5 |
0.58 |
2 |
0.5 |
0.5 |
0.5 |
0.625 |
2 |
0.5 |
0.6 |
0.5 |
0.68 |
2 |
0.5 |
0.7 |
0.5 |
0.745 |
2 |
0.5 |
0.8 |
0.5 |
0.82 |
2 |
0.5 |
0.9 |
0.5 |
0.905 |
2 |
0.5 |
1 |
0.5 |
1 |
Table 4
n |
l |
q |
|
R |
2 |
0.5 |
0.1 |
0.1 |
0.835 |
2 |
0.5 |
0.1 |
0.2 |
0.717143 |
2 |
0.5 |
0.1 |
0.3 |
0.62875 |
2 |
0.5 |
0.1 |
0.4 |
0.56 |
2 |
0.5 |
0.1 |
0.5 |
0.505 |
2 |
0.5 |
0.1 |
0.6 |
0.46 |
2 |
0.5 |
0.1 |
0.7 |
0.4225 |
2 |
0.5 |
0.1 |
0.8 |
0.390769 |
2 |
0.5 |
0.1 |
0.9 |
0.363571 |
2 |
0.5 |
0.1 |
1 |
0.34 |
Case 6: Random- fixed Stress and random- independent Strength
Table 1
n |
p |
q |
l |
|
R |
1 |
0.5 |
0.5 |
0.2 |
0.1 |
0.83333 |
1 |
0.5 |
0.5 |
0.2 |
0.2 |
0.75 |
1 |
0.5 |
0.5 |
0.2 |
0.3 |
0.7 |
1 |
0.5 |
0.5 |
0.2 |
0.4 |
0.6666 |
1 |
0.5 |
0.5 |
0.2 |
0.5 |
0.6428 |
1 |
0.5 |
0.5 |
0.2 |
0.6 |
0.625 |
1 |
0.5 |
0.5 |
0.2 |
0.7 |
0.6111 |
1 |
0.5 |
0.5 |
0.2 |
0.8 |
0.6 |
1 |
0.5 |
0.5 |
0.2 |
0.9 |
0.5909 |
1 |
0.5 |
0.5 |
0.2 |
1 |
0.5833 |
Table 2
p |
q |
l |
|
n |
R |
0.5 |
0.5 |
0.2 |
0.1 |
1 |
0.8333 |
0.5 |
0.5 |
0.2 |
0.1 |
2 |
0.7083 |
0.5 |
0.5 |
0.2 |
0.1 |
3 |
0.6125 |
0.5 |
0.5 |
0.2 |
0.1 |
4 |
0.5375 |
0.5 |
0.5 |
0.2 |
0.1 |
5 |
0.4776 |
0.5 |
0.5 |
0.2 |
0.1 |
6 |
0.4291 |
0.5 |
0.5 |
0.2 |
0.1 |
7 |
0.3891 |
0.5 |
0.5 |
0.2 |
0.1 |
8 |
0.3556 |
0.5 |
0.5 |
0.2 |
0.1 |
9 |
0.3241 |
0.5 |
0.5 |
0.2 |
0.1 |
10 |
0.3030 |
Table 3
p |
q |
|
n |
l |
R |
0.5 |
0.5 |
0.2 |
1 |
0.1 |
0.6666 |
0.5 |
0.5 |
0.2 |
1 |
0.2 |
0.75 |
0.5 |
0.5 |
0.2 |
1 |
0.3 |
0.8 |
0.5 |
0.5 |
0.2 |
1 |
0.4 |
0.8333 |
0.5 |
0.5 |
0.2 |
1 |
0.5 |
0.8571 |
0.5 |
0.5 |
0.2 |
1 |
0.6 |
0.875 |
0.5 |
0.5 |
0.2 |
1 |
0.7 |
0.8889 |
0.5 |
0.5 |
0.2 |
1 |
0.8 |
0.9 |
0.5 |
0.5 |
0.2 |
1 |
0.9 |
0.9091 |
0.5 |
0.5 |
0.2 |
1 |
1 |
0.9167 |
Case 7: Random- independent Stress and deterministic Strength
Table 1
n |
l |
p |
|
R |
1 |
0.2 |
0.2 |
0.5 |
0.819033 |
2 |
0.2 |
0.2 |
0.5 |
0.670814 |
3 |
0.2 |
0.2 |
0.5 |
0.549419 |
4 |
0.2 |
0.2 |
0.5 |
0.449992 |
5 |
0.2 |
0.2 |
0.5 |
0.368558 |
6 |
0.2 |
0.2 |
0.5 |
0.301861 |
7 |
0.2 |
0.2 |
0.5 |
0.247234 |
8 |
0.2 |
0.2 |
0.5 |
0.202493 |
9 |
0.2 |
0.2 |
0.5 |
0.165848 |
10 |
0.2 |
0.2 |
0.5 |
0.135835 |
Table 2
n |
l |
p |
|
R |
3 |
1 |
0.2 |
0.5 |
0.678442 |
3 |
2 |
0.2 |
0.5 |
0.795114 |
3 |
3 |
0.2 |
0.5 |
0.872007 |
3 |
4 |
0.2 |
0.5 |
0.920977 |
3 |
5 |
0.2 |
0.5 |
0.951553 |
3 |
6 |
0.2 |
0.5 |
0.970424 |
3 |
7 |
0.2 |
0.5 |
0.981991 |
3 |
8 |
0.2 |
0.5 |
0.989051 |
3 |
9 |
0.2 |
0.5 |
0.993349 |
3 |
10 |
0.2 |
0.5 |
0.995963 |
Table 3
n |
l |
p |
|
R |
3 |
0.5 |
0.1 |
0.5 |
0.784083 |
3 |
0.5 |
0.2 |
0.5 |
0.601724 |
3 |
0.5 |
0.3 |
0.5 |
0.450089 |
3 |
0.5 |
0.4 |
0.5 |
0.326342 |
3 |
0.5 |
0.5 |
0.5 |
0.227651 |
3 |
0.5 |
0.6 |
0.5 |
0.151181 |
3 |
0.5 |
0.7 |
0.5 |
0.094097 |
3 |
0.5 |
0.8 |
0.5 |
0.053565 |
3 |
0.5 |
0.9 |
0.5 |
0.026752 |
3 |
0.5 |
1 |
0.5 |
0.010823 |
Table 4
n |
l |
p |
|
R |
3 |
0.5 |
0.2 |
1 |
0.678442 |
3 |
0.5 |
0.2 |
2 |
0.795114 |
3 |
0.5 |
0.2 |
3 |
0.872007 |
3 |
0.5 |
0.2 |
4 |
0.920977 |
3 |
0.5 |
0.2 |
5 |
0.951553 |
3 |
0.5 |
0.2 |
6 |
0.970424 |
3 |
0.5 |
0.2 |
7 |
0.981991 |
3 |
0.5 |
0.2 |
8 |
0.989051 |
3 |
0.5 |
0.2 |
9 |
0.993349 |
3 |
0.5 |
0.2 |
10 |
0.995963 |
Case 8: Random- independent Stress and random- fixed Strength
Table 1
n |
µ |
p |
l |
R |
1 |
0.5 |
0.5 |
0.1 |
0.6666 |
1 |
0.5 |
0.5 |
0.2 |
0.75 |
1 |
0.5 |
0.5 |
0.3 |
0.8 |
1 |
0.5 |
0.5 |
0.4 |
0.8333 |
1 |
0.5 |
0.5 |
0.5 |
0.8571 |
1 |
0.5 |
0.5 |
0.6 |
0.875 |
1 |
0.5 |
0.5 |
0.7 |
0.8889 |
1 |
0.5 |
0.5 |
0.8 |
0.9 |
1 |
0.5 |
0.5 |
0.9 |
0.9091 |
1 |
0.5 |
0.5 |
1 |
0.9167 |
Table 2
n |
l |
p |
µ |
R |
1 |
0.2 |
0.5 |
0.1 |
0.83333 |
1 |
0.2 |
0.5 |
0.2 |
0.75 |
1 |
0.2 |
0.5 |
0.3 |
0.7 |
1 |
0.2 |
0.5 |
0.4 |
0.6666 |
1 |
0.2 |
0.5 |
0.5 |
0.6428 |
1 |
0.2 |
0.5 |
0.6 |
0.625 |
1 |
0.2 |
0.5 |
0.7 |
0.6111 |
1 |
0.2 |
0.5 |
0.8 |
0.6 |
1 |
0.2 |
0.5 |
0.9 |
0.5909 |
1 |
0.2 |
0.5 |
1 |
0.5833 |
Table 3
n |
l |
p |
µ |
R |
1 |
0.2 |
0.5 |
0.1 |
0.8333 |
2 |
0.2 |
0.5 |
0.1 |
0.7166 |
3 |
0.2 |
0.5 |
0.1 |
0.6321 |
4 |
0.2 |
0.5 |
0.1 |
0.5688 |
5 |
0.2 |
0.5 |
0.1 |
0.5199 |
6 |
0.2 |
0.5 |
0.1 |
0.4811 |
7 |
0.2 |
0.5 |
0.1 |
0.4496 |
8 |
0.2 |
0.5 |
0.1 |
0.4234 |
9 |
0.2 |
0.5 |
0.1 |
0.4012 |
10 |
0.2 |
0.5 |
0.1 |
0.3821 |
Case 9: Random- independent Stress and random- independent Strength
Table 1
n |
l |
|
p |
q |
R |
1 |
0.2 |
0.5 |
0.9 |
0.1 |
0.357143 |
2 |
0.2 |
0.5 |
0.8 |
0.2 |
0.183673 |
3 |
0.2 |
0.5 |
0.7 |
0.3 |
0.125 |
4 |
0.2 |
0.5 |
0.6 |
0.4 |
0.106622 |
5 |
0.2 |
0.5 |
0.5 |
0.5 |
0.109792 |
6 |
0.2 |
0.5 |
0.4 |
0.6 |
0.13281 |
7 |
0.2 |
0.5 |
0.3 |
0.7 |
0.184864 |
8 |
0.2 |
0.5 |
0.2 |
0.8 |
0.291357 |
9 |
0.2 |
0.5 |
0.1 |
0.9 |
0.513261 |
10 |
0.2 |
0.5 |
0 |
1 |
1 |
Table 2
n |
l |
|
p |
q |
R |
1 |
0.5 |
0.1 |
0.1 |
0.9 |
0.983333 |
2 |
0.5 |
0.1 |
0.2 |
0.8 |
0.934444 |
3 |
0.5 |
0.1 |
0.3 |
0.7 |
0.857375 |
4 |
0.5 |
0.1 |
0.4 |
0.6 |
0.758835 |
5 |
0.5 |
0.1 |
0.5 |
0.5 |
0.647228 |
6 |
0.5 |
0.1 |
0.6 |
0.4 |
0.531441 |
7 |
0.5 |
0.1 |
0.7 |
0.3 |
0.419636 |
8 |
0.5 |
0.1 |
0.8 |
0.2 |
0.318285 |
9 |
0.5 |
0.1 |
0.9 |
0.1 |
0.231617 |
10 |
0.5 |
0.1 |
1 |
0 |
0.161506 |
Table 3
n |
l |
|
p |
q |
R |
2 |
0.1 |
0.5 |
0.9 |
0.1 |
0.0625 |
2 |
0.2 |
0.5 |
0.8 |
0.2 |
0.183673 |
2 |
0.3 |
0.5 |
0.7 |
0.3 |
0.316406 |
2 |
0.4 |
0.5 |
0.6 |
0.4 |
0.444444 |
2 |
0.5 |
0.5 |
0.5 |
0.5 |
0.5625 |
2 |
0.6 |
0.5 |
0.4 |
0.6 |
0.669421 |
2 |
0.7 |
0.5 |
0.3 |
0.7 |
0.765625 |
2 |
0.8 |
0.5 |
0.2 |
0.8 |
0.852071 |
2 |
0.9 |
0.5 |
0.1 |
0.9 |
0.929847 |
2 |
1 |
0.5 |
0 |
1 |
1 |
Table 4 Table 5
n |
l |
|
p |
q |
R |
2 |
0.1 |
0.5 |
0.1 |
0.9 |
0.840278 |
2 |
0.2 |
0.5 |
0.2 |
0.8 |
0.734694 |
2 |
0.3 |
0.5 |
0.3 |
0.7 |
0.660156 |
2 |
0.4 |
0.5 |
0.4 |
0.6 |
0.604938 |
2 |
0.5 |
0.5 |
0.5 |
0.5 |
0.5625 |
2 |
0.6 |
0.5 |
0.6 |
0.4 |
0.528926 |
2 |
0.7 |
0.5 |
0.7 |
0.3 |
0.501736 |
2 |
0.8 |
0.5 |
0.8 |
0.2 |
0.47929 |
2 |
0.9 |
0.5 |
0.9 |
0.1 |
0.460459 |
2 |
1 |
0.5 |
1 |
0 |
0.444444 |
n |
l |
|
p |
q |
R |
2 |
0.5 |
0.1 |
0.1 |
0.9 |
0.966944 |
2 |
0.5 |
0.2 |
0.2 |
0.8 |
0.88898 |
2 |
0.5 |
0.3 |
0.3 |
0.7 |
0.787656 |
2 |
0.5 |
0.4 |
0.4 |
0.6 |
0.676049 |
2 |
0.5 |
0.5 |
0.5 |
0.5 |
0.5625 |
2 |
0.5 |
0.6 |
0.6 |
0.4 |
0.452562 |
2 |
0.5 |
0.7 |
0.7 |
0.3 |
0.350069 |
2 |
0.5 |
0.8 |
0.8 |
0.2 |
0.257751 |
2 |
0.5 |
0.9 |
0.9 |
0.1 |
0.177602 |
2 |
0.5 |
1 |
1 |
0 |
0.111111 |
Table 6
n |
l |
|
p |
q |
R |
2 |
0.5 |
0.1 |
0.9 |
0.1 |
0.7225 |
2 |
0.5 |
0.2 |
0.8 |
0.2 |
0.595102 |
2 |
0.5 |
0.3 |
0.7 |
0.3 |
0.543906 |
2 |
0.5 |
0.4 |
0.6 |
0.4 |
0.537778 |
2 |
0.5 |
0.5 |
0.5 |
0.5 |
0.5625 |
2 |
0.5 |
0.6 |
0.4 |
0.6 |
0.61124 |
2 |
0.5 |
0.7 |
0.3 |
0.7 |
0.680625 |
2 |
0.5 |
0.8 |
0.2 |
0.8 |
0.768994 |
2 |
0.5 |
0.9 |
0.1 |
0.9 |
0.875561 |
2 |
0.5 |
1 |
0 |
1 |
1 |
Conclusion
Reliability is found when the number of cycles follows Binomial distribution for the following nine models:1. Deterministic stress and deterministic Strength, 2.Deterministic stress and random- fied strength, 3. Deterministic Stress and random-independent strength, 4. Random- fixed Stress and deterministic strength, 5.Random- fixed stress and random – fixed strength, 6. Random- fixed stress and random- independent Strength, 7.Random- independent Stress and deterministic Strength, 8. Random- independent Stress and Random- fixed Strength, 9. Random- independent Stress and random- independent Strength for random cycles Reliability computed for all the nine modelswhen stress and strength follow exponential distribution.
References
- M.N.Gopalan, P.Venkateswarlu(1982): Reliability analysis of time – dependent cascade system with deterministic cycle times, Microelectron Relib., Vol.22, No. 4, pp: 841-872.
- Kapur, K.C. and Lamberson, L.R. (1977): Reliability in Engineering Design, John Wiley and Sons, Inc.
- Schatz, R., Shooman, M. And Shaw, L.(1974): Applications of Time- Dependent Stress- Strength Models of Non- Electrical and Electrical Systems, Proceedings of Reliability and Maintainability Symposium, January, pp. 540-547.
