|
|
||||||||||||||||||||||||||||||||||||||||||||||||||||||||||||||||||||||||||||||||||||||||||||||||||||||||||||||||||||||||||||||||||||||
|
|
Home| Journals | Statistics Online Expert | About Us | Contact Us | |||||||||||||||||||||||||||||||||||||||||||||||||||||||||||||||||||||||||||||||||||||||||||||||||||||||||||||||||||||||||||||||||||||
 |
||||||||||||||||||||||||||||||||||||||||||||||||||||||||||||||||||||||||||||||||||||||||||||||||||||||||||||||||||||||||||||||||||||||
| About this Journal | Table of Contents | ||||||||||||||||||||||||||||||||||||||||||||||||||||||||||||||||||||||||||||||||||||||||||||||||||||||||||||||||||||||||||||||||||||||
|
|
[Abstract]
[PDF]
[HTML]
[Linked
References] D – Optimal Design for Compound Poisson Regression Model
S. Joshua David1* and C. Santharam2† 1,2 Department of Statistics, Loyola College, Chennai – 600034 (TN) INDIA. Corresponding Addresses: *[email protected], †[email protected] Research Article
Abstract: D- Optimality is one of the most commonly used design criteria for linear regression model. In industrial experiments binary or count data often arise, for example defective/non- defective or number of defects. For such data (GLMS) are appropriate Generalized Linear Models are especially useful for actuarial applications, since they allow estimate multiplicative models, and also allow forms of heteroscedasticity such as they are found frequently in actuarial problems, of Poisson-type, of gamma-type with a fixed coefficient of variation. An analogous D-optimality design criterion can be developed using asymptotic covariance matrix, for GLM, this matrix is a weighted version of the covariance matrix for the linear case, and the extension of existing D-optimality algorithm. We consider the problem of finding an optimal design under a compound Poisson regression model with a, any number of independent variables and a reciprocal link additive model linear predictor. Local D-optimality of a class of designs is established through use of a canonical form of the problem and a general equivalence theorem. The theorem is applied in conjunction with clustering techniques to obtain a fast method of finding designs that are robust to wide ranges of model parameter values. Key words: Compound Poisson, Clustering, Locally optimal design, Inverse link models.
Introduction: D-optimality is a standard optimal design for linear regression model, partly because it corresponds to minimizing the area of confidence region for unknown parameters, and partly because it is reasonably easy mathematically and computationally. In actuarial statistics non-normal response are often measured. For such a data Compound Poisson regression models is appropriate (see for example McCullagh and Nelder 1989 and Dobson 1983). Compound Poisson optimal design criterion have been developed for the exponential dispersion model are directly applicable to the compound Poisson distribution applications of this particular compound distribution, primarily in the form of generalized linear models [GLM], have been found in actuarial science (Smyth and J_rgensen 2002), animal studies (Perry 1981), assay analysis (Davidian 1990), botany studies (Dunn and Smyth 2005), survival analysis (Hougaard, Harvald, and Holm 1992), rainfall modeling (Dunn 2004) and _shery research (Shono 2008). An often neglected part of the analysis is the estimation of the unknown variance function, i.e., the index parameter p. This parameter has a signi_cant impact on hypothesis tests and predictive Uncertainty measures (Davidian and Carroll 1987; Peters, Shevchenko, and Wuthrich 2009; Zhang 2012), which is of independent interest in many applications. One approach in estimating the Variance function is using the prole likelihood (Cox and Reid 1987). For the compound Poisson distribution, such an approach must be implemented based on the true likelihood rather than the extended quasi-likelihood (Nelder and Pregibon 1987). Unlike other compound distributions whose density must be approximated via the slow recursive approach (Klugman, Panjer, andWillmot 2008), methods that enable fast and accurate numerical evaluation of compound Poisson density function are available (Dunn and Smyth 2005, 2008). These methods are provided by the tweedie package (Dunn 2011). With the density approximation methods, we can carry out not only maximum likelihood estimation but also Bayesian inference using Markov chain Monte Carlo methods (Gelman, arlin,Stern, and Rubin 2003). The D-Optimality Criterion for Compound Poisson Model The motivation for a D-optimality criterion for GLMs can be seen as a simple extension of the linear case. One way of viewing the linear case is that a D-optimal design will yield the smallest confidence regions for the parameters of interest. In the GLM setting, confidence statements are often made on an asymptotic basic, via the information matrix. The inverse expected information matrix
Where Var The expected information does not depend on the form of the distribution beyond the mean and variance relations stated above. Dobson (1983, Appendix 2) shows that for GLMs with the above specification, the
This can be written in matrix notation: I = Where W is a diagonal matrix with elements:
Thus the asymptotic variance covariance matrix The simplest form of Compound Poisson model use the inverse link function given as follows.
The linear predictor is define by
The information matrix under the inverse gamma model, given an observation at x, is Where And The important application for this model is to find the point of maximum or minimum response and to estimate the parameters. The optimal design is the choice of points and corresponding weights that optimize the selected criterion function; the criterion function is commonly related to precision of the parameter estimates, such as the size of a confidence region of the sum of the variance of the parameter estimators. The criterion function involves the standardized information matrix. The standardized information matrix given a particular design The D-Optimality is the most common criterion `which seeks to maximize Maximizing the determinant of the information matrix (X’X) is equivalent to Minimizing the determinant of the dispersion matrix D-optimality criterion is just to maximize the determinant of the Fisher information matrix. Using such an idea, the D-efficiency of an arbitrary design, X, is naturally defined as X* is the true optimal design.
There are several methods to the practise of determining the optimal design. These include algorithms, analytical, numerical and graphical methods. The derivation of D-optimal designs will be illustrated for three parameter sets: θA=(-3 , 1 0); θB=(0,1,0) and θC=(3,1,0) Step 1: To find the symmetric design consisting of p=3 points with equal design weights is assumed.
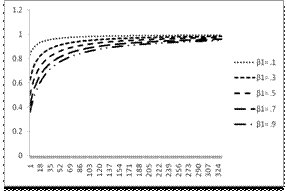
The optimal design depends on the values of β, so if they are known we can find the optimal design. The linear predictor is Table: Support points of the locally D-optimal design for the Compound Poisson model for various values of
Conclusion: The analytic contraction of D-optimal Compound Poisson model with inverse link function were derived to obtain locally D-optimal design, the solution to these formulae can be obtain numerically using R- software in contrast to using for examples algorithms which involve issues like finding a good initial design. Thus the locally D-optimal design depends only on the parameters β with varying Xi values it is the function of mean values. We conclude that when the optimal design with inverse link function have a inverse relationship between function of mean values and the predicted vales. When the function of mean values is decreasing the predictors are increasing the design involves asymptotic information matrix. The linear predictor attains maximal optimal values for the different β values it converges to one for various functional mean values.
References:
|
|||||||||||||||||||||||||||||||||||||||||||||||||||||||||||||||||||||||||||||||||||||||||||||||||||||||||||||||||||||||||||||||||||||
|
||||||||||||||||||||||||||||||||||||||||||||||||||||||||||||||||||||||||||||||||||||||||||||||||||||||||||||||||||||||||||||||||||||||