|
|
||||||||||||||||||||||||||||||||||||||||||||||||||||||||||||||||||||||||
|
|
Home| Journals | Statistics Online Expert | About Us | Contact Us | |||||||||||||||||||||||||||||||||||||||||||||||||||||||||||||||||||||||
 |
||||||||||||||||||||||||||||||||||||||||||||||||||||||||||||||||||||||||
| About this Journal | Table of Contents | ||||||||||||||||||||||||||||||||||||||||||||||||||||||||||||||||||||||||
|
|
[Abstract]
[PDF]
[HTML]
[Linked
References] Identifying Health Checkup Patients Blood Pressure Profile Using TwoStep Cluster Analysis
G. Manimannan, S. Hari and G. Vijaythiraviyam Department of Statistics, Madras Christian College, Tambaram, Chennai, Tamil Nadu, INDIA. Corresponding Addresses: [email protected], [email protected], [email protected] Research Article
Abstract: In this research paper we analyze information about the Blood Pressure (BP) systolic and diastolic of Master Health Checkup (MHC) patients of a secondary data, dividing them into six clusters, using Two Step Cluster method. This method is ideal for our case study because, compared to other traditional clustering techniques, Two Step uses combination of data (both continuous and categorical variables) and it also finds the best possible number of clusters. In particular, this area was chosen as a model to study Master Health Checkup (MHC). The data were collected from secondary source containing 460 patients. The case sheet deals with demographic characteristics, Blood Pressure, Fat, Liver and diabetic parameters. In our study, we concentrate on age, BP Systolic and diastolic only. Two Step Cluster analysis creates six type BP Systolic and diastolic MHC patients reports. In BP systolic the first, third and fourth cluster contains pre hypertension patients, the second cluster consist of desired and hypotension patients, but the fifth and sixth cluster consists of mixed BP systolic MHC patients. In BP diastolic the first cluster contains hypertension, the second and fourth cluster consists of desired and hypotension, the third cluster contains pre hypertensions, the fifth cluster contains mixed BP diastolic, the last cluster is accommodated by pre hypertension and hypertensive crisis. Key words: TwoStep Cluster, clustering, pre-clustering, MHC Patients
1. Introduction The Master Health Check-up (MHC) is offered by various hospitals and medical research institute is a programme that attempts to reduce health care costs by prevention and early diagnosis. A variety of chronic diseases afflict us, most of which take their toll after the fifth decade of life. Diabetes, hypertension, heart attacks, stroke and cancer are some of the more common examples. Almost all of these problems first go through a long quiescent phase where they produce no symptoms. This period can be as long as 10 - 20 years. It makes sense, therefore, that a programme that attempts to detect and correct these problems during this silent phase will decrease the ultimate morbidity from these diseases. In the early days of preventive health check-ups, every conceivable test and technology was ordered in the hope that some would be abnormal and provide an avenue of approach. A handful of items, mostly simple, appear to provide the greatest value. The MHC offered at various hospitals and institutes is a carefully constructed programme that offers a panel of tests that are proven to be valuable. As an incentive to those who have taken the efforts to control their health problems, the programme also includes two or more follow up visits within a year of the MHC and the physician in charge of the checkup. Good health is by itself of great value. It enhances market earnings by increasing the number of healthy days an individual has available for work (Grossman 1972) and increases non- market productivity, allowing more time for household production (Becker 1976). Health checkups help to secure and maintain good health. In the present context the problem of MHC patients has been studied, without making any assumptions with regard to the number of groups or any other structural patterns in advance, which reflected the classification of patients based on certain medical observations (G. Manimannan, S. Hari and G. Vijaythiraviyam). The main objective of this paper is to investigate the automatic selection of the number of clusters using Two Step Cluster analysis for age, BP Systolic and diastolic of MHC patients. The rest of the paper is organized as follows. Section 2 describes the methodology we have used, the database and the choice of MHC parameters. Section 3 presents the proposed algorithm which is used as a benchmark to achieve the objective on applying one of the well known statistical classification model TwoStep Cluster Analysis and Section 4 presents the empirical results. The conclusions of our study are presented in Section 5. The applications that can use clustering algorithms belong to various fields. However, most of these algorithms work with numerical data or categorical data. Nevertheless, data from real world contains both numerical and categorical attributes. TwoStep Cluster is an SPSS method which solves this problem.
2. Methodologies and Database This section brings out the discussion of the database, the MHC (Master Health Checkup) parameters selected and TwoStep Clustering Techniques. The MHC data were collected from secondary source of OPD (Out Patients Department) containing 460 patients in Private Hospital, Bangalore was considered as the database. The data mainly consists of five major categories, such as socio economic and demographic characteristic, Blood Pressure, Fat, Liver and diabetic related parameters. In this research paper, we are considered MHC patients age, BP systolic and diastolic for TwoStep Cluster analysis. 2.1 Algorithm for Two Step Cluster Analysis The Two Step Cluster Analysis method is an exploratory tool designed to reveal natural groupings (or clusters) within a data set that would otherwise not be clear. The algorithm employed by this procedure has several desirable features that differentiate it from traditional statistical clustering techniques: Step1: The ability to create clusters based on both categorical and continuous variables. Step 2: Automatic selection of the number of clusters. Step 3: The ability to analyze huge data files efficiently.
2.2 Clustering Principles In order to handle categorical and continuous variables, the Two Step Cluster Analysis procedure uses a likelihood distance measure which assumes that variables in the cluster model are independent. Further, each continuous variable is assumed to have a normal (Gaussian) distribution and each categorical variable is assumed to have a multinomial distribution. Empirical internal testing indicates that the procedure is fairly robust to violations of both the assumption of independence and the distributional assumptions, but you should try to be aware of how well these assumptions are met. The two steps of the Two Step Cluster Analysis procedure's algorithm can be summarized as follows: Step 1. The procedure begins with the construction of a Cluster Features (CF) Tree. The tree begins by placing the first case at the root of the tree in a leaf node that contains variable information about that case. Each successive case is then added to an existing node or forms a new node, based upon its similarity to existing nodes and using the distance measure as the similarity criterion. A node that contains multiple cases contains a summary of variable information about those cases. Thus, the CF tree provides a capsule summary of the data file. Step 2. The leaf nodes of the CF tree are then grouped using an agglomerative clustering algorithm. The agglomerative clustering can be used to produce a range of solutions. To determine which number of clusters is "best", each of these cluster solutions is compared using Schwarz's Bayesian Criterion (BIC) or the Akaike Information Criterion (AIC) as the clustering criterion (BIRCH by Zhang et al, 1996)
2.3 Number of clusters: auto-cluster A characteristic of hierarchical clustering is that it produces a sequence of partitions in one run: 1, 2, 3 … clusters. A K-means algorithm would need to run multiple times (one for each specified number of clusters) in order to generate the sequence. To determine the number of clusters automatically, SPSS developed a two-step procedure that works well with the hierarchical clustering method. In the first step, the BIC or AIC for each number of clusters within a specified range is calculated and used to find the initial estimate for the number of clusters. In the second step, the initial estimate is refined by finding the largest increase in distance between the two closest clusters in each hierarchical clustering stage.
The BIC and AIC for
Where
2.4 Distance Measure A distance measure is needed in both the pre-cluster and cluster steps. Two distance measures are available. 2.5 Log-Likelihood Distance The log-likelihood distance measure can handle both continuous and categorical variables. It is a probability based distance. The distance between two clusters is related to the decrease in log-likelihood as they are combined into one cluster. In calculating log-likelihood, normal distributions for continuous variables and multinomial distributions for categorical variables are assumed. It is also assumed that the variables are independent of each other, and so are the cases. The distance between clusters
If
2.6 Euclidean distance This distance measure can only be applied if all variables are continuous. The Euclidean distance between two points is clearly defined. The distance between two clusters is here defined by the Euclidean distance between the two cluster centers. A cluster center is defined as the vector of cluster means of each variable. In our research paper, we are using log-likelihood distance measure.
3. Result and Discussion The Auto-Clustering table can be used to assess the optimal number of clusters in our analysis, as shown below. Table 1: Auto-Clustering
In Table 1, although the lowest BIC coefficient is for six clusters, according to the SPSS algorithm, the optimal number of clusters is six, because the largest ratio of distances is for six clusters. The cluster distribution is shown in Table 2. Table 2: Cluster Distribution
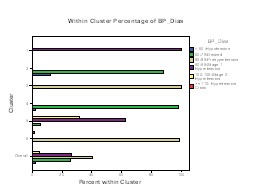
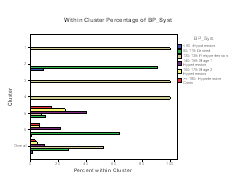
SPSS presents also the frequencies for each categorical variable. Table 3 shows the frequencies for BP systolic and diastolicvariables. For categorical variables, the within-cluster percentage plot shows how each variable is split within each cluster. In Figure 1 and 2, it is shown the contribution of variable property within each of the six clusters. In BP systolic, note that in cluster 1, 3 and 4 the predominant patient is pre hypertension, while in cluster 2 and 6 it is the desired and the hypertension stage I in cluster 5. In BP diastolic, cluster 1 and 5 the predominant patients are in stage I hypertensions, while in cluster 2 and 4 are in desired and the pre hypertension patients dominated in cluster 3 and 4. Table 3: BP Systolic and Diastolic Frequency and their Cluster Size
Figure 1 and Figure 2: BP Systolic and Diastolic Cluster
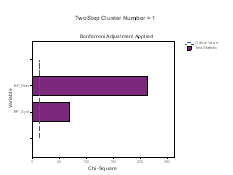
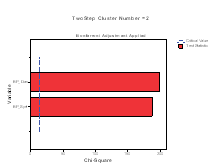
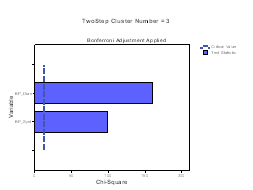
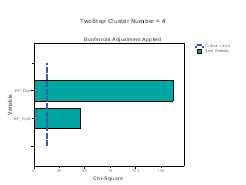
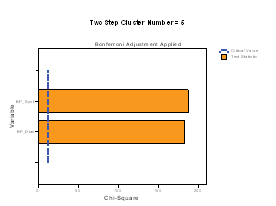
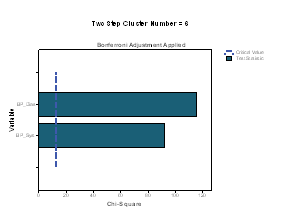
The Categorical Variable wise Importance plots are presented for each cluster. On the X‐axis the chi‐square statistic and on the Y‐axis the list of categorical variables is represented. If bars exceed the critical value line, then it indicates that the variables are important in distinguishing the clusters from each other. In Figure 3 we present the importance of the categorical variables for the first six clusters. Note that BP systolic and BP diastolic contribute the most to differentiating in all clusters.
Figure 3: Categorical variable and their Importance
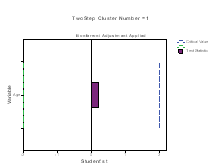
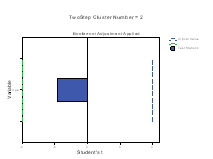
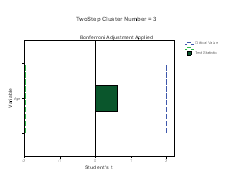
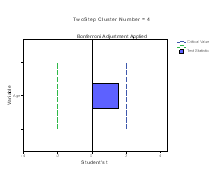
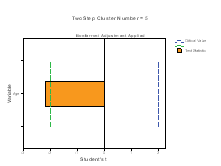
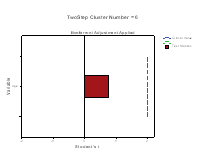
The Continuous Variable wise Importance plots are printed for each cluster. On the X‐axis is the Student’s t statistic and on the Y‐axis is the continuous variable. If bar exceeds the critical value line, then it indicates that the variable is important in distinguishing the clusters from each other. The plots below (Figure 5) shows that Clusters 1, 3, 4 and 6 are differentiated by mean age of the patients in a positive direction, while Clusters 2 and are differentiated by age in a negative direction.
Table 4: Centroids
In the above table, reveals that the average age of the MHC patients distributed in each cluster. To interesting to note that, in all the clusters fall in the age of 45 to 50 categories of MHC patients.
Regarding the continuous variables importance for cluster 1-6, all the 6 clusters are differentiated by the BP variables (Systolic and Diastolic) in a positive direction, while in the age of MHC four clusters are accommodated in positive direction (clusters 1,3,4 and 6), but the negative variables contribute more to differentiation of cluster 2 and 5.
Figure 5: Categorical variable and their Importance
Two Step Cluster analysis creates six types of BP Systolic and diastolic MHC patients reports. In BP systolic the first (76), third (109) and fourth (50) cluster contains pre hypertension patients, the second cluster (75) consist of desired and hypotension patients, but the fifth (72) and sixth (78) cluster consists of mixed BP systolic MHC patients. In BP diastolic the first (76) cluster contain hypertension, the second (75) and fourth (50) cluster consists of desired and hypotension, the third (109) cluster contains pre hypertensions, the fifth ( 72) cluster contains mixed BP diastolic, the last (78) cluster accommodated pre hypertension and hypertensive crisis. 5. Conclusions Clustering methods can be applied in various fields which use large datasets, just to find hidden patterns. Since most data are taken from the real world which contains both numerical and categorical attributes, classical clustering algorithms cannot work efficiently with such data. To solve this problem, we showed that TwoStep method can be easily used, which also determines the optimal number of clusters automatically. Applying this method to our data, we identified six MHC Patients profiles. Two Step Cluster analysis creates six type BP Systolic and diastolic MHC patients reports. In BP systolic the first, third and fourth cluster contains pre hypertension patients, the second cluster consist of desired and hypotension patients, but the fifth and sixth cluster consists of mixed BP systolic MHC patients. In BP diastolic the first cluster contain hypertension, the second and fourth cluster consists of desired and hypotension, the third cluster contains pre hypertensions, the fifth cluster contains mixed BP diastolic, the last cluster accommodated pre hypertension and hypertensive crisis. In all the clusters the MHC patients fall in the age category of 45 to 50 (in BP systolic and diastolic). This case study is useful for a health care which intends to split the patients, for a better treatment. When new patients turn up for MHC proper treatment can be given based on TwoStep Classification.
References
|
|||||||||||||||||||||||||||||||||||||||||||||||||||||||||||||||||||||||
|
||||||||||||||||||||||||||||||||||||||||||||||||||||||||||||||||||||||||